Fig. 1
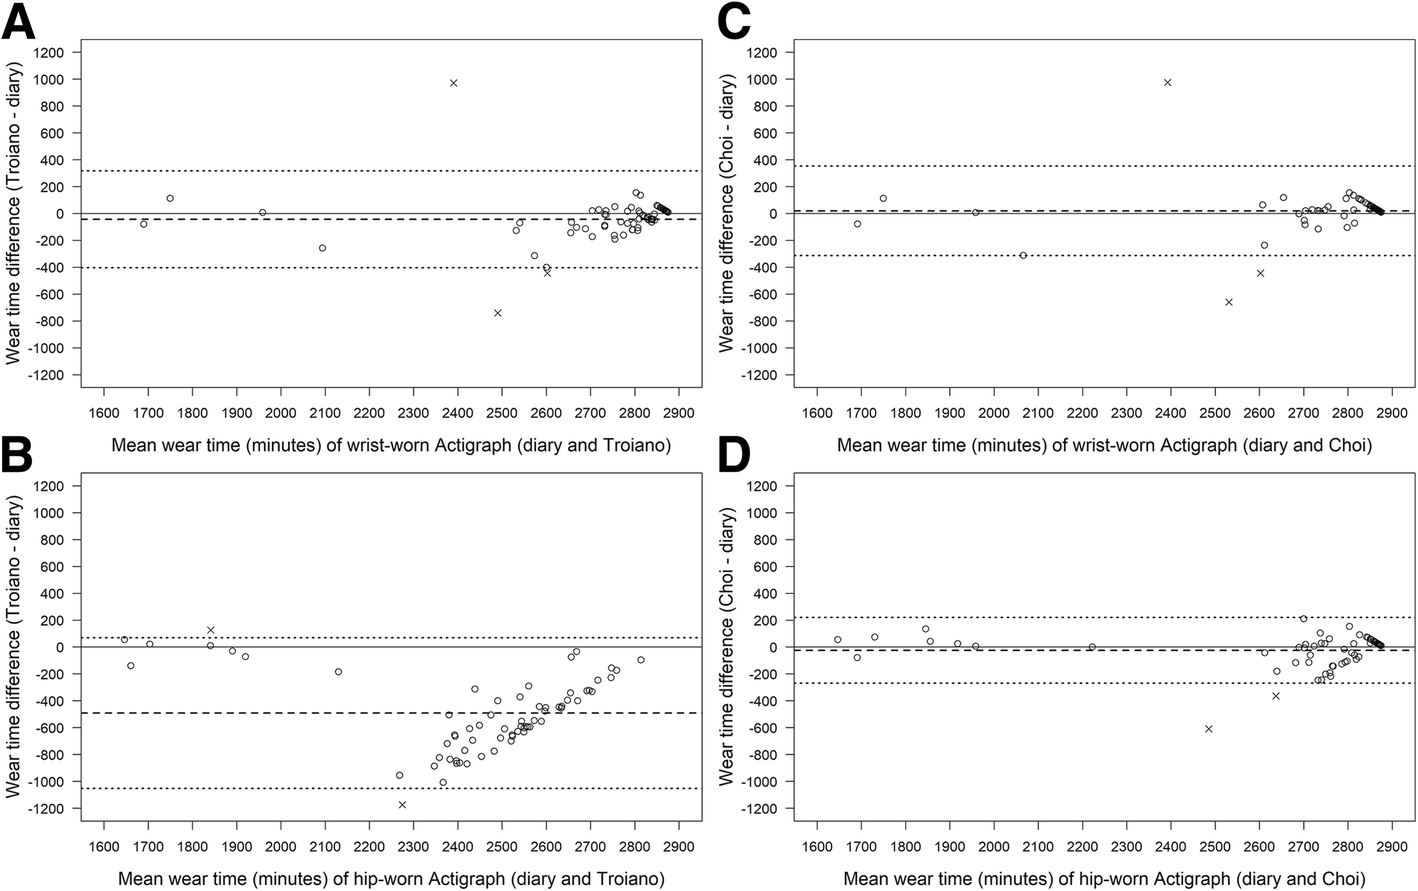
Bland–Altman plot of the total wear time (minutes) from the diaries and wrist-worn ActiGraph calculated by Troiano (a), wrist-worn ActiGraph calculated by Choi (b), hip-worn ActiGraph calculated by Troiano (c), hip-worn ActiGraph calculated by Choi (d). The dashed lines denote the bias (i.e. the mean difference) and the dotted lines denote the 95% limits of agreement